Drones and photogrammetry to calculate access to Renewable Solar Energy
Architects at WDS-LAB use of Drone Photogrammetry for calculating renewable solar energy accessibility.
In the complex task of transitioning existing low density residential areas to renewable energies, Drones have proven to be an effective tool to understand the amount of solar energy that could be gathered directly from their roofs. WDS-LAB (www.wds-lab.com ) is an architectural consultancy studio based in London that focuses on researching how new technologies can help us create more sustainable and resilient neighbourhoods and reduce its Climate Change potential. Its team has created a novel workflow using drone technology and Photogrammetry, to estimate the amount of solar energy that can be captured in urban environments.

Dense Point Cloud classification with Artificial Intelligence
With help of machine learning algorithms, we can classify the elements of the landscape we have captured getting an accurate understanding of the elements we can find in these locations. Once we have a classified point cloud we can get precise measurements of the areas that are built and separate these from the vegetation, ground areas, or other elements that are not necessary for the study. The goal of these Solar studies is to separate precisely the roof surfaces from the building surfaces so we can conduct solar exposure and incident radiation analysis.

Advanced algorithms to separate roof area for Solar analysis
Commercial point cloud classification tools don’t allow separating surfaces accurately or running solar analysis. At W-LAB we have developed custom tools to accurately separate roof geometries from the rest of the construction planes. This helps us to precisely get the geometry we need to run solar analysis only on these areas we want. We can also evaluate other things like the orientation of any surface to get understand the hours of solar exposure or energy they will receive over the year to better understand its potential to get renewable solar energy and allocate solar pannls


Remote Thermal Sensing and High-Resolution Thermal Orthophoto maps
Our thermal camera drones are fit to flight on preprogrammed missions. This allows us to get accurate thermal maps to understand things like solar exposure, solar heat gain and heat island effect, and even thermal losses through facades and roofs. The image below shows the thermal 2D map of the neighbourhood studied for this project and the temperature difference between the built areas, and those with vegetation (darker colour = lower temperature).
Thermal orthophoto map of the Studied area
An overview of the Domestic Energy consumption in Great Britain in 2020
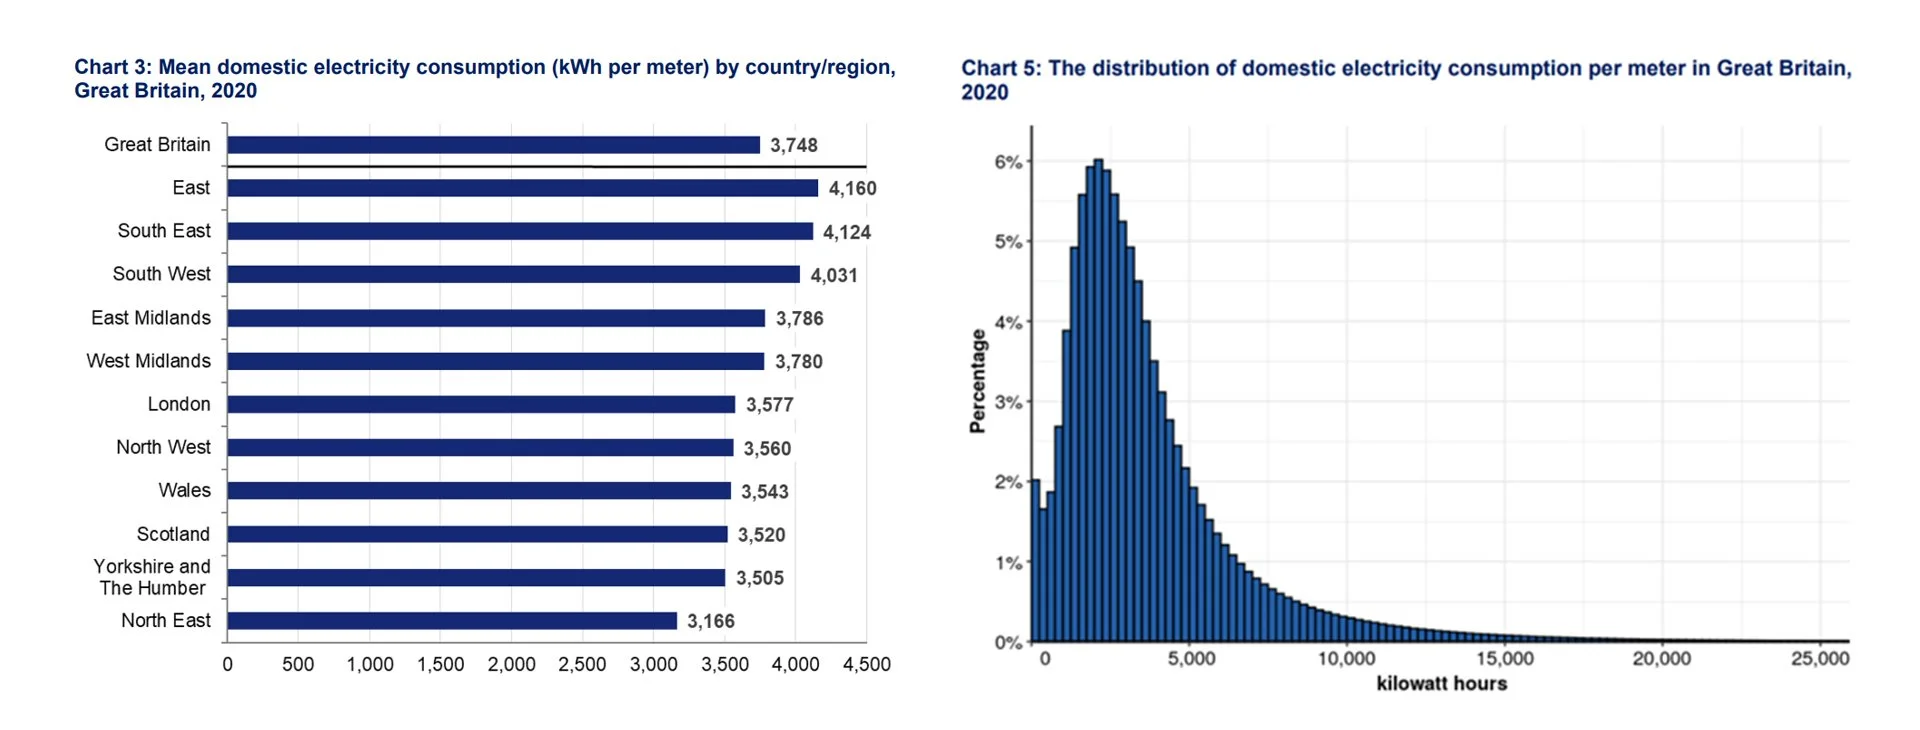
According to the British Climate Change Committee, The UK has around 29million homes that with outdated constructive systems, that are responsible for wasting vast amounts of energy, on heating, and also cooling in the hottest months. To meet the Paris agreement and keep global warming below 1.5C, CO2 emissions from residential areas need to be reduced to at least 78% in the following decade, towards achieving Net Zero in 2050. In order to retrofit these homes, solar energy can play a crucial role to help them achieve a great percentage of energy from renewables directly onsite. According to the Sub National Electricity and Gas Consumption Statistics Report provided by the Department of Business Energy and Industrial Strategy, in great Britain mean annual domestic electricity consumption in 2020, was 3,750 kWh, while the median domestic electricity consumption was 2,900 kWh. This difference between the mean and median is more pronounced for electricity than for gas because of the variety of ways electricity is used in homes.
Solar Panel equivalent area and Renewable energy production
The generated algorithms were able to automatically slice the mesh and classify the roof geometries, separating them from the rest of the building surfaces. This reduced the number of polygons needed to analyse with the solar analysis engine. Solar access analysis quantified the hours of sun an incident energy that a geometry could receive in a given time period and calculate its accumulation in each mesh face. This process took into account hourly global horizontal irradiance values, and the shadows that any adjacent element could cast on them. It was a computationally heavy operation, but the slicing and classification made the whole analysis process much faster, than if we try to analyse everything at once.

Calculating the Area of Solar PV we could allocate on top of the roofs
It was estimated that 80% of the roof surfaces would be geometrically suitable to allocate solar PV’s, since geometries in residential roofs often have irregularities like chimney and telecommunication features or other elements that could make it hard to integrate rectangular commercial solar panels of 1x1,7m. A total area of 17,000m2 of solar panels could be fitted in the roofs of the sampled neighbourhood. For a better understanding of the PV array dimensions we generated a graphic in relationship to the studied neighbourhood
With this roof area, we would supply 3 times more electricity than needed
For this study standard databases for solar photovoltaic panels were used by the team and assumed the values that can be seen in the summary table (Figure 11). The calculations of the energy produced annually showed that the whole array of solar panels, if placed horizontally looking upwards, would receive a total energy of 2,335,016 kWh. If we take into account the annual median household consumption in Great Britain according to the Department of Business Energy and Industrial Strategy (2,900kWh / year / household), we would be able to power 800 households annually with this amount of solar energy, gathered directly from the roofs. (It’s understood that batteries would be needed to store the energy so even at night time all the residential units would get covered). The sampled neighbourhood had 258 residences, so the estimation is that roofs could gather 3 times the energy needed from solar if we accumulate the energy produced in one year.
Conclusions
Using tools for architectural environmental simulation on photogrammetry models captured with drones, has proven to be a fast and reliable system, for energy assessors and architects, to understand better the access we could have to renewable energy, locally in urban environments. Thanks to this experimental workflow, WDS-LAB estimates that with this amount of PVs allocated in the roofs of a neighbourhood like the one studied, we could get more energy from renewables than needed. Excess energy could be used to power other buildings and create a balance with other areas with higher residential density helping a city like London to reduce its carbon footprint.